# How a tornado works
> 🌪️ **Live demo**:
> ·
> 📦 **Source**:
>
> Every illustration in this doc has a **matching preset** in the app —
> use the "📷 Doc preset…" dropdown at the top of the app to view any
> figure live, mouse-orbitable, with the actual parameters behind it.
A visual primer using live output from this simulator. Every image below
is a real PNG dumped straight off the WebGPU canvas — no diagrams, no
textbook plates. What you see is what the Navier–Stokes solver
produced from the parameters labelled in each caption.
---
## 1. What *is* a tornado?
A tornado is a violently rotating column of air connecting a thunderstorm
cloud aloft to the ground. Its defining feature is **vorticity** — a
measure of how much the air at each point is spinning. Plot the regions
where the spin exceeds a threshold and you get this:
*Three nested shells of |ω| (vorticity magnitude) at increasing thresholds.
The outer cool-blue shell is "where it spins at all"; the inner warm-orange
shell marks the violently spinning core. The ground is at the bottom,
the cloud base would be off the top of the frame.*
The tube is **narrow but tall** — typically 50–500 m across and several
kilometres high. Inside the tube, wind speeds can exceed 100 m/s
(EF4–EF5 on the Enhanced Fujita scale).
---
## 2. The signature: rotation around a vertical axis
If we slice the bottom of the tube horizontally and color-code the
**tangential** wind speed (positive = anticlockwise from above), the
fingerprint of a vortex jumps out:
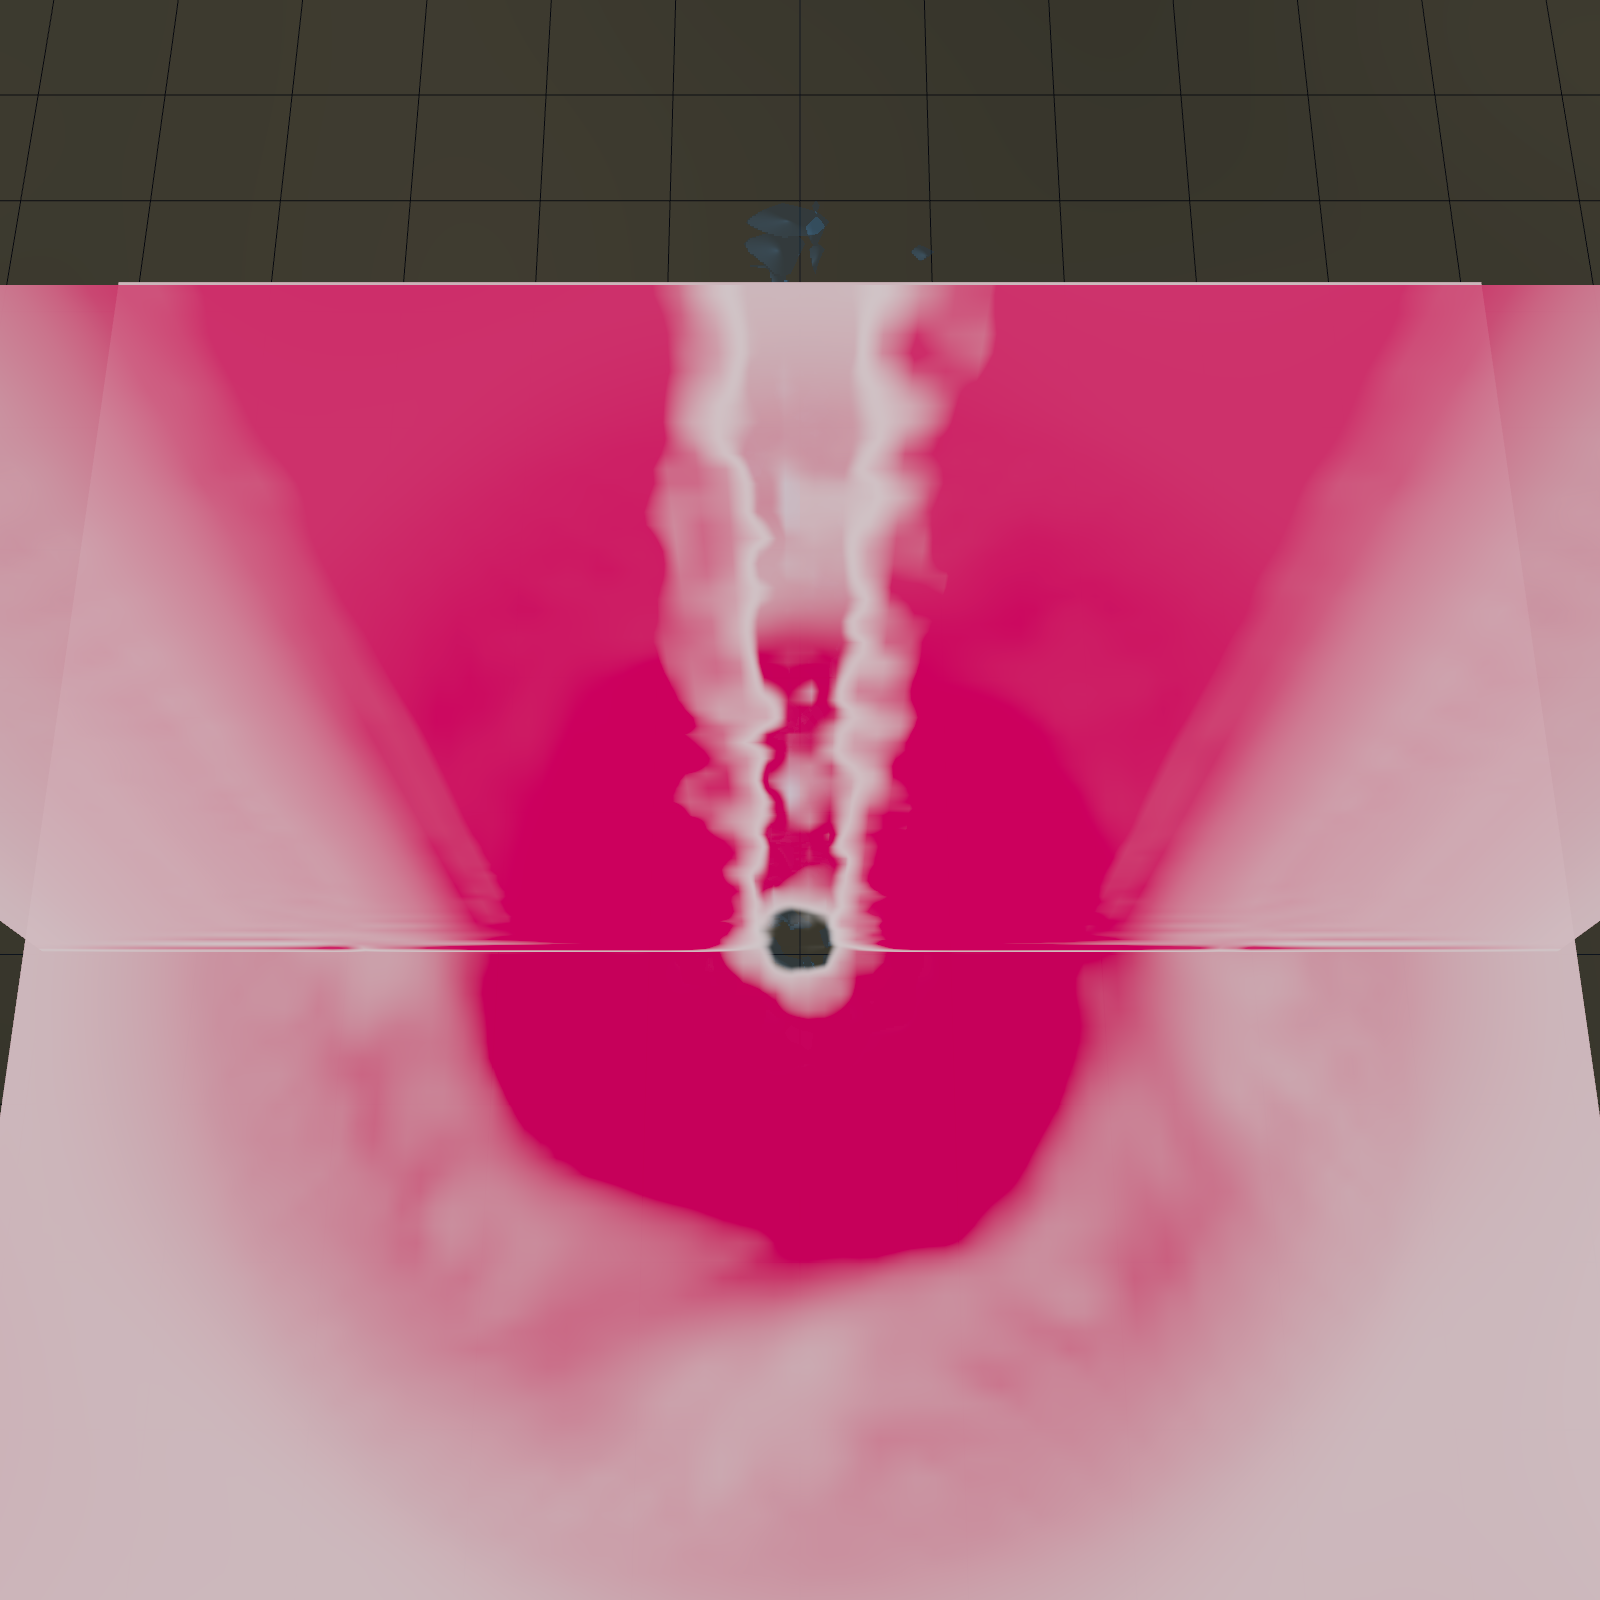
*Tangential velocity V_θ on a horizontal slab at z ≈ 50 m. Pink = strong
counter-clockwise rotation (positive); white = calm. The bright
**ring** is the so-called eyewall — a narrow band where wind speed peaks.
Outside the ring it falls off; inside it falls off again toward a
near-still core. This is the **Rankine combined vortex** profile.*
The radius of that ring is one of the two numbers that define a tornado:
**`R_max`** — distance from the axis to peak wind. The peak wind itself is
**`V_max`**. Together they say everything about how big and how strong.
---
## 3. Where does the air come from?
Air doesn't rotate forever in a sealed loop — it has to come from
somewhere and go somewhere. Plotting the **radial** velocity (wind
component pointing toward or away from the axis) shows the inflow:
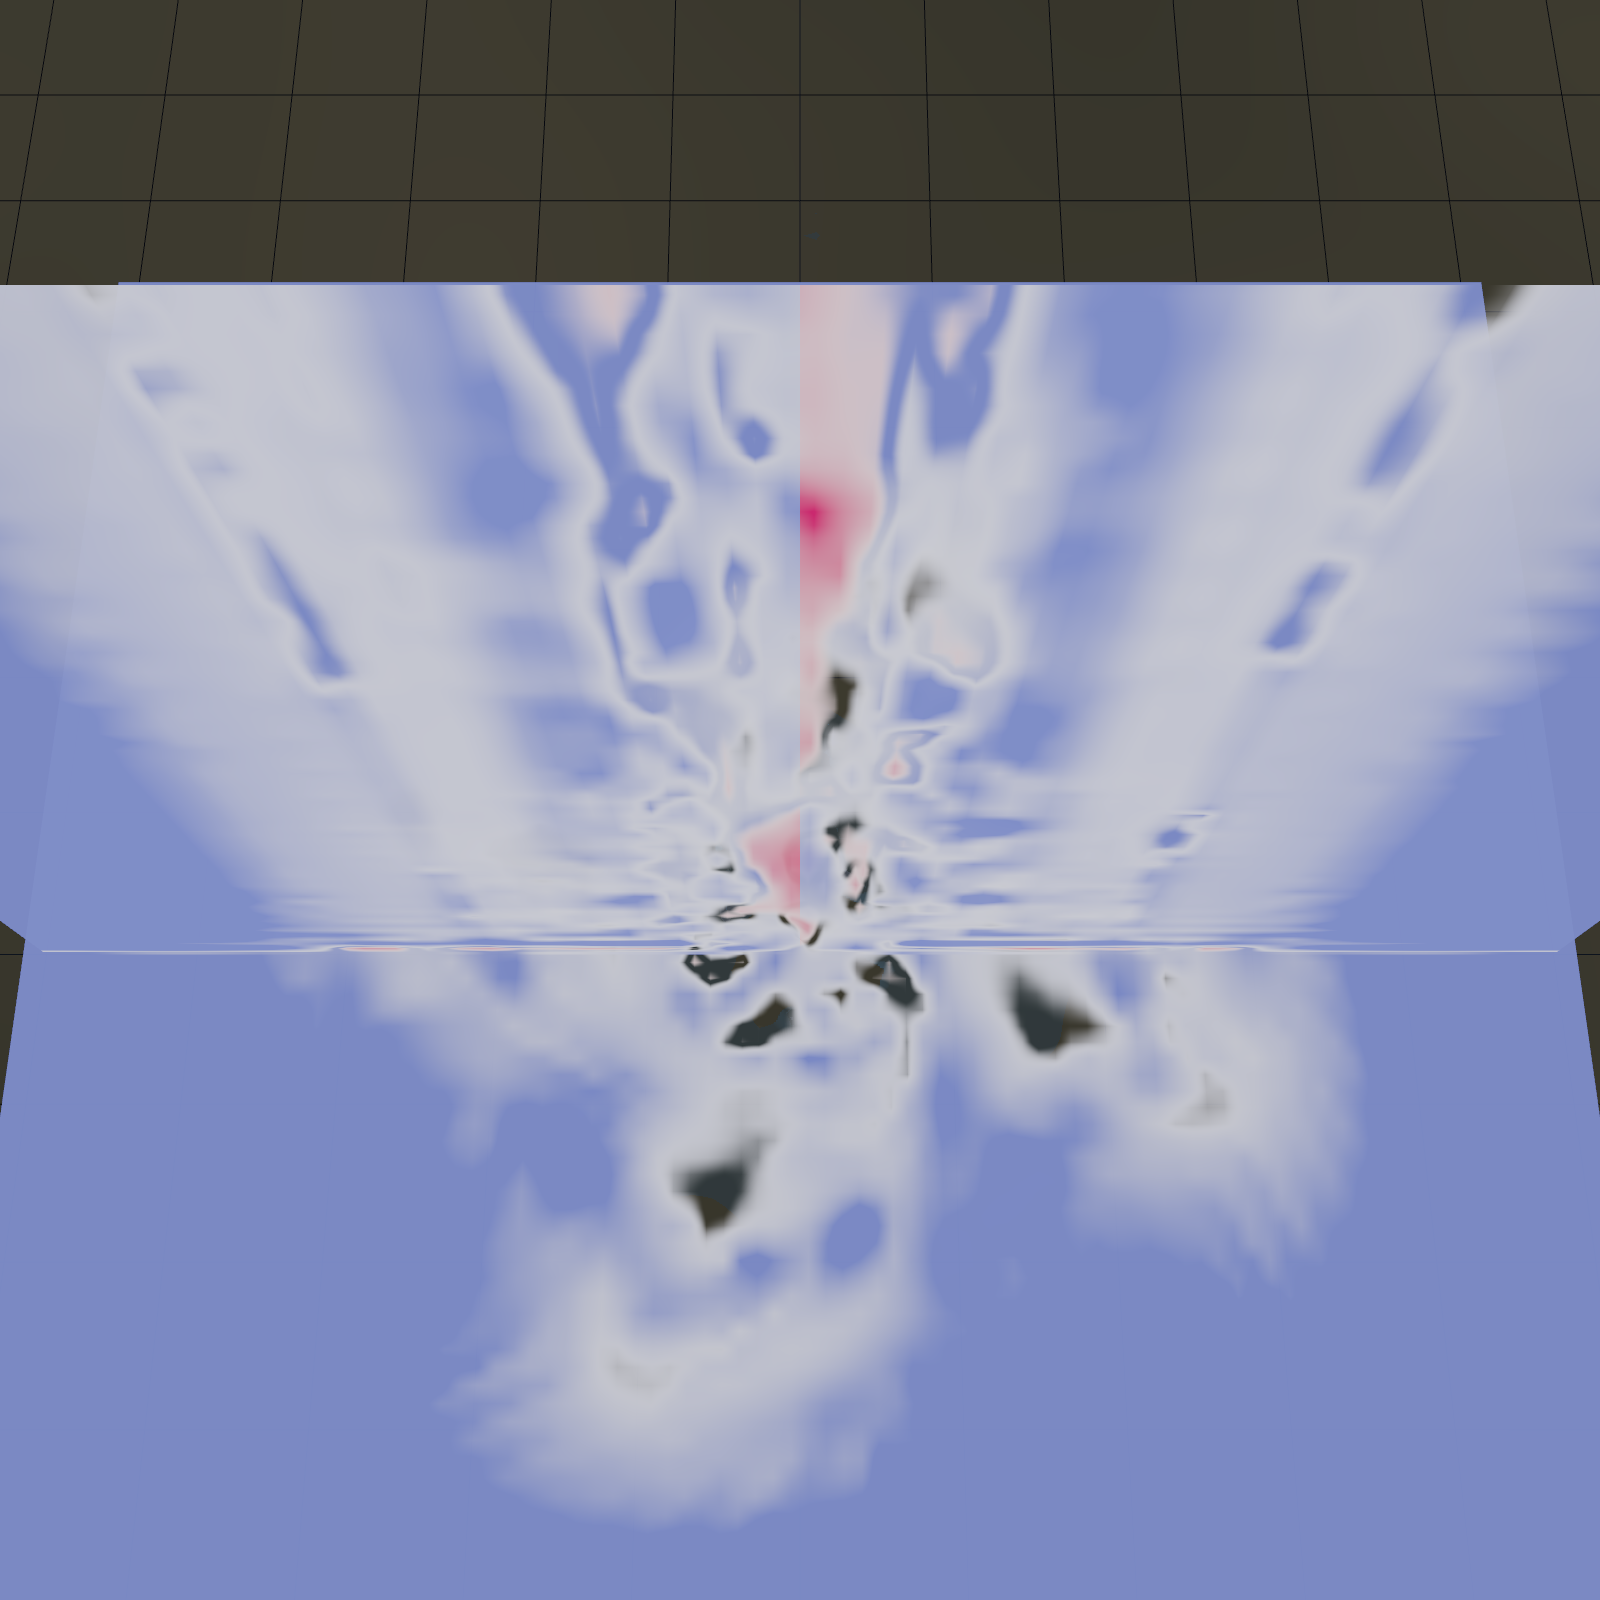
*Radial velocity V_r on the same low-altitude slab. Blue = inflow
(air moving inward toward the axis), red = outflow (none here).
Ground-level air is sucked **inward** from all directions.*
That inflow has to go somewhere — and since it can't pile up at the
axis, it goes **up**. The tornado is essentially a giant suction tube:
horizontal convergence at the surface, vertical updraft into the
parent storm aloft.
---
## 4. The pressure deficit (and why air rushes in)
Why does the air come inward in the first place? Newton's second law:
to keep a parcel of air moving in a circle, you need a centripetal force
pointing toward the axis. Nature provides this via a **pressure
gradient** — pressure has to be lower at the centre than outside, so
that air is "squeezed" inward.
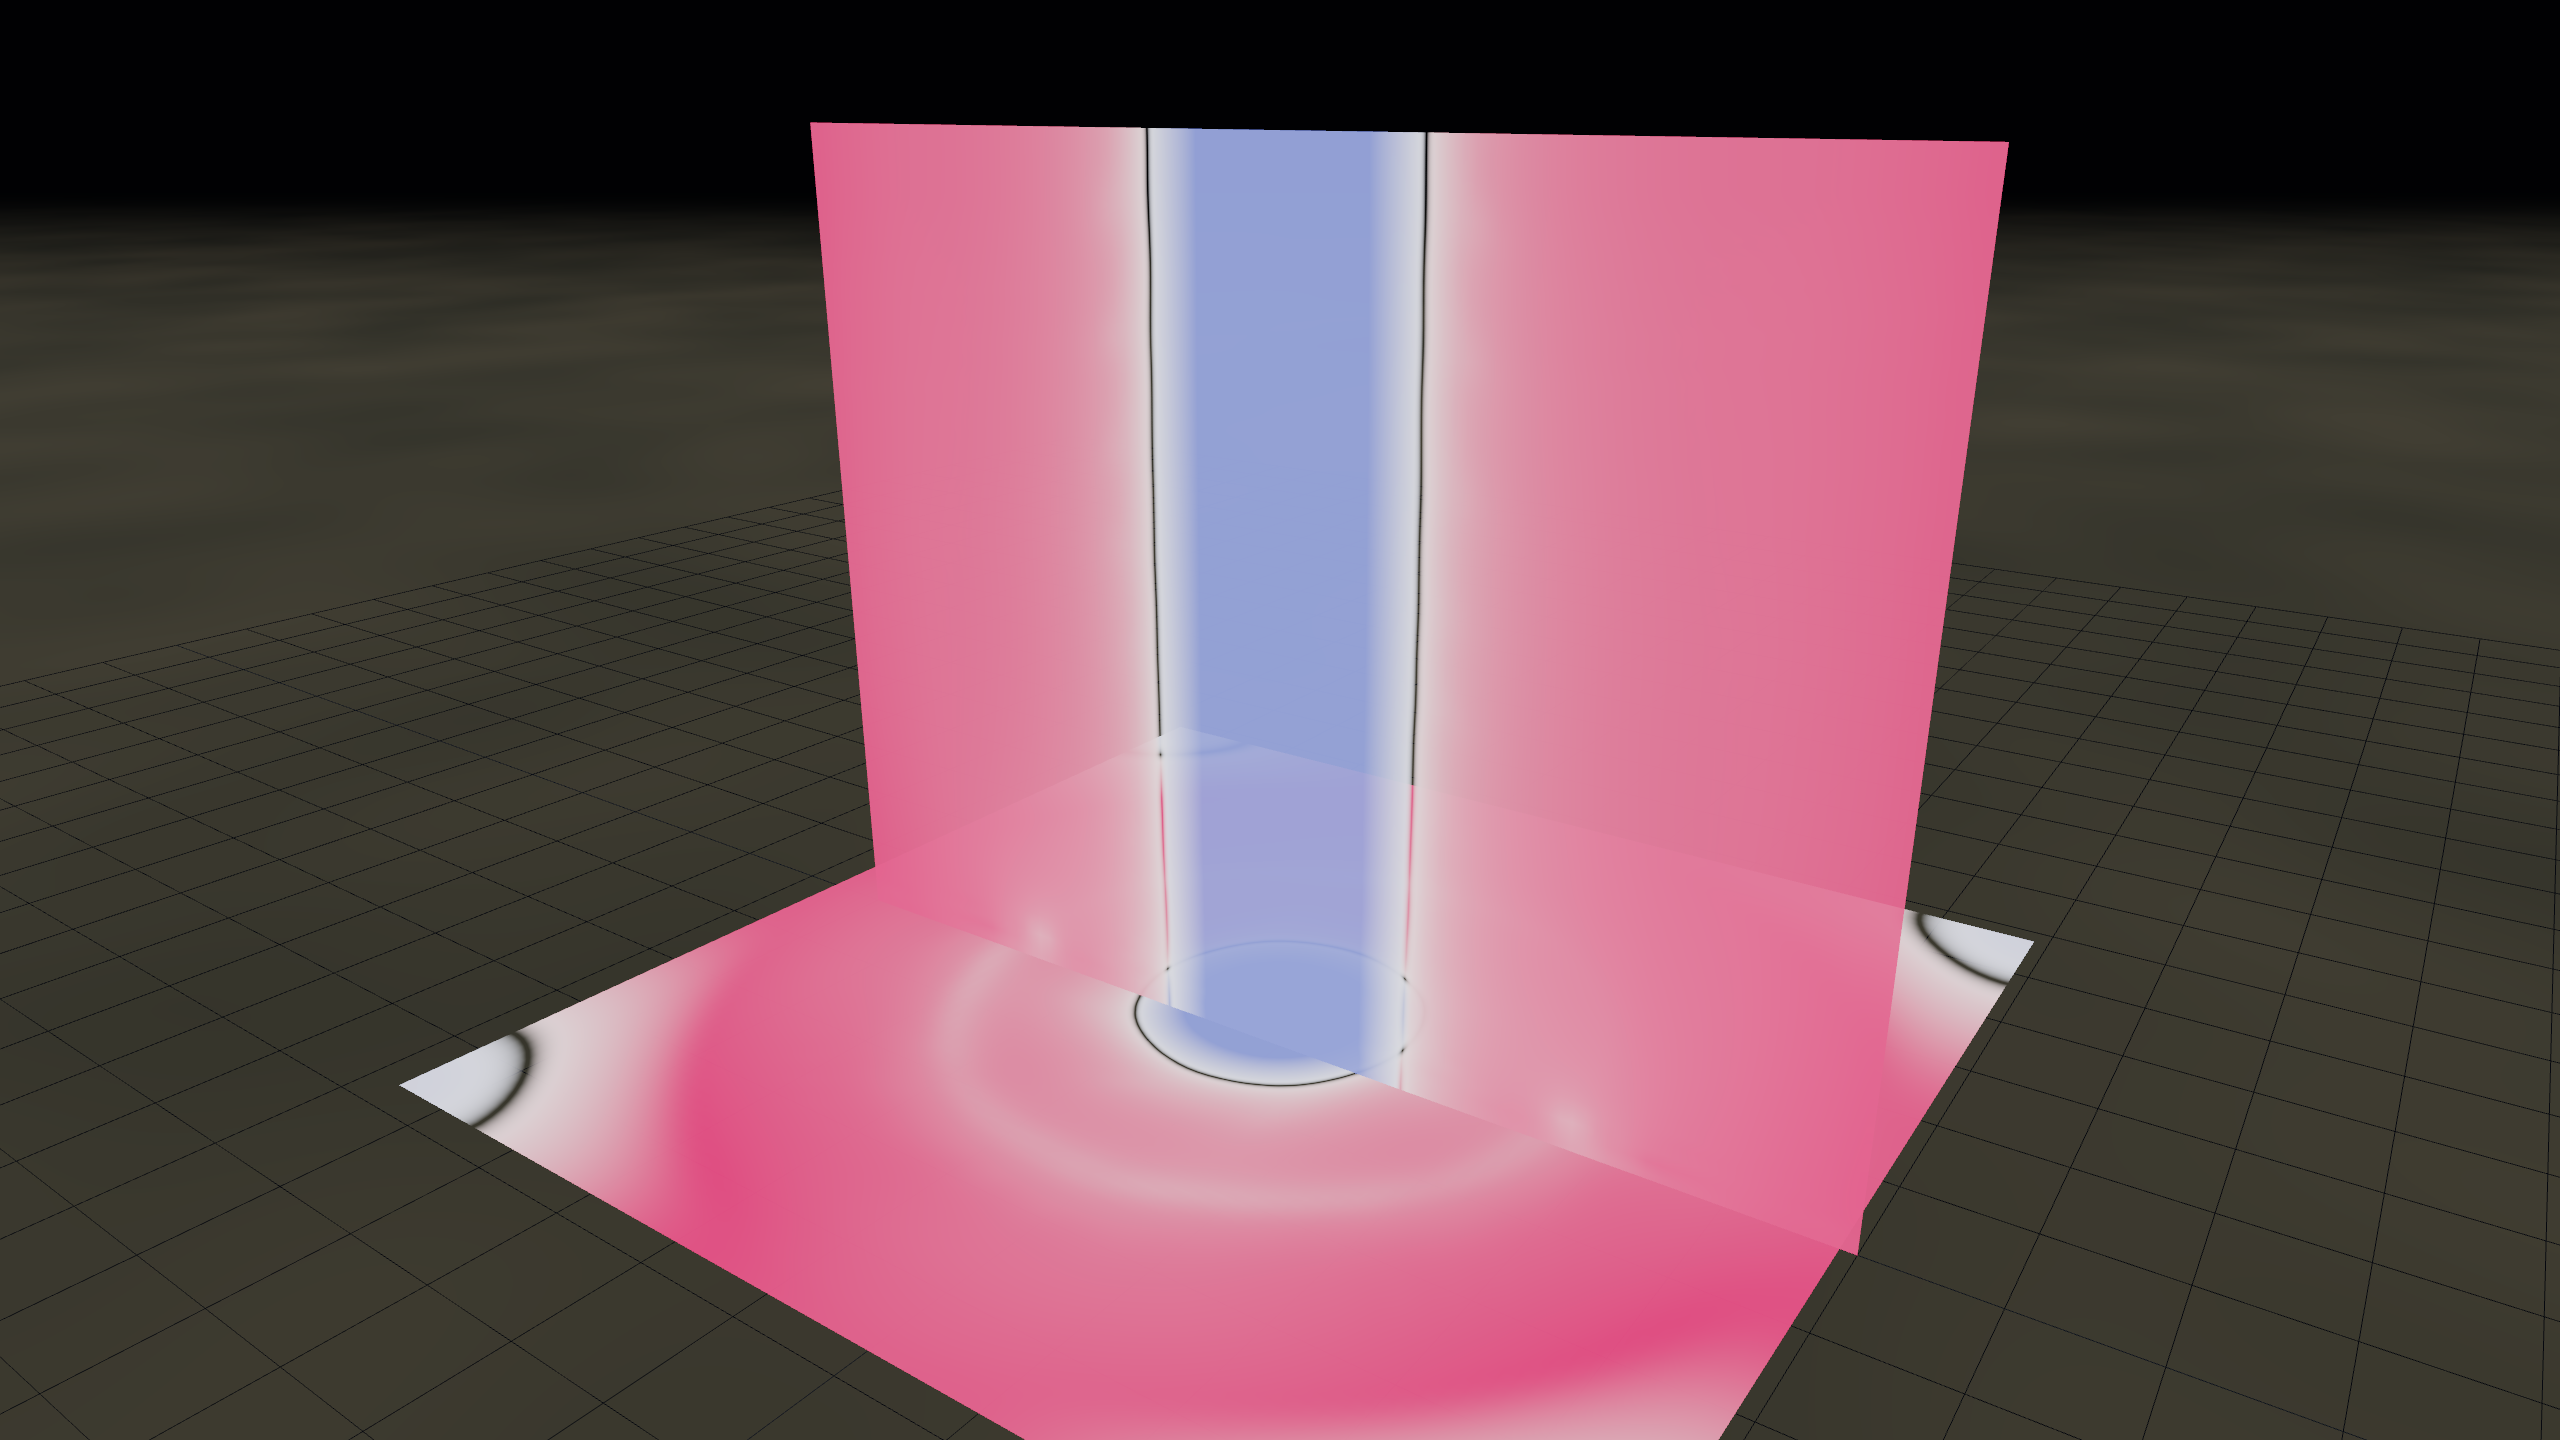
*Pressure deviation ΔP from ambient. Pink = above ambient, blue = below.
The deep blue **column** along the vortex axis is the cyclostrophic
deficit, where ΔP ≈ −ρ · V_max². At V_max = 95 m/s with ρ ≈ 1.2 kg/m³
this works out to about −110 hPa — roughly **10% lower than ambient
sea-level pressure**, in a column maybe 50 m wide.*
That deficit is what actually destroys buildings: the violent winds tear
at the structure while the pressure drop tries to lift the roof off.
---
## 5. The full speed picture (LIC visualization)
So far we've sliced the wind into V_θ, V_r, V_z — but the actual flow
is a swirling spiral that has all three. Plotting **wind speed
magnitude** with **line-integral convolution** painted on top reveals
the whole thing in one shot:
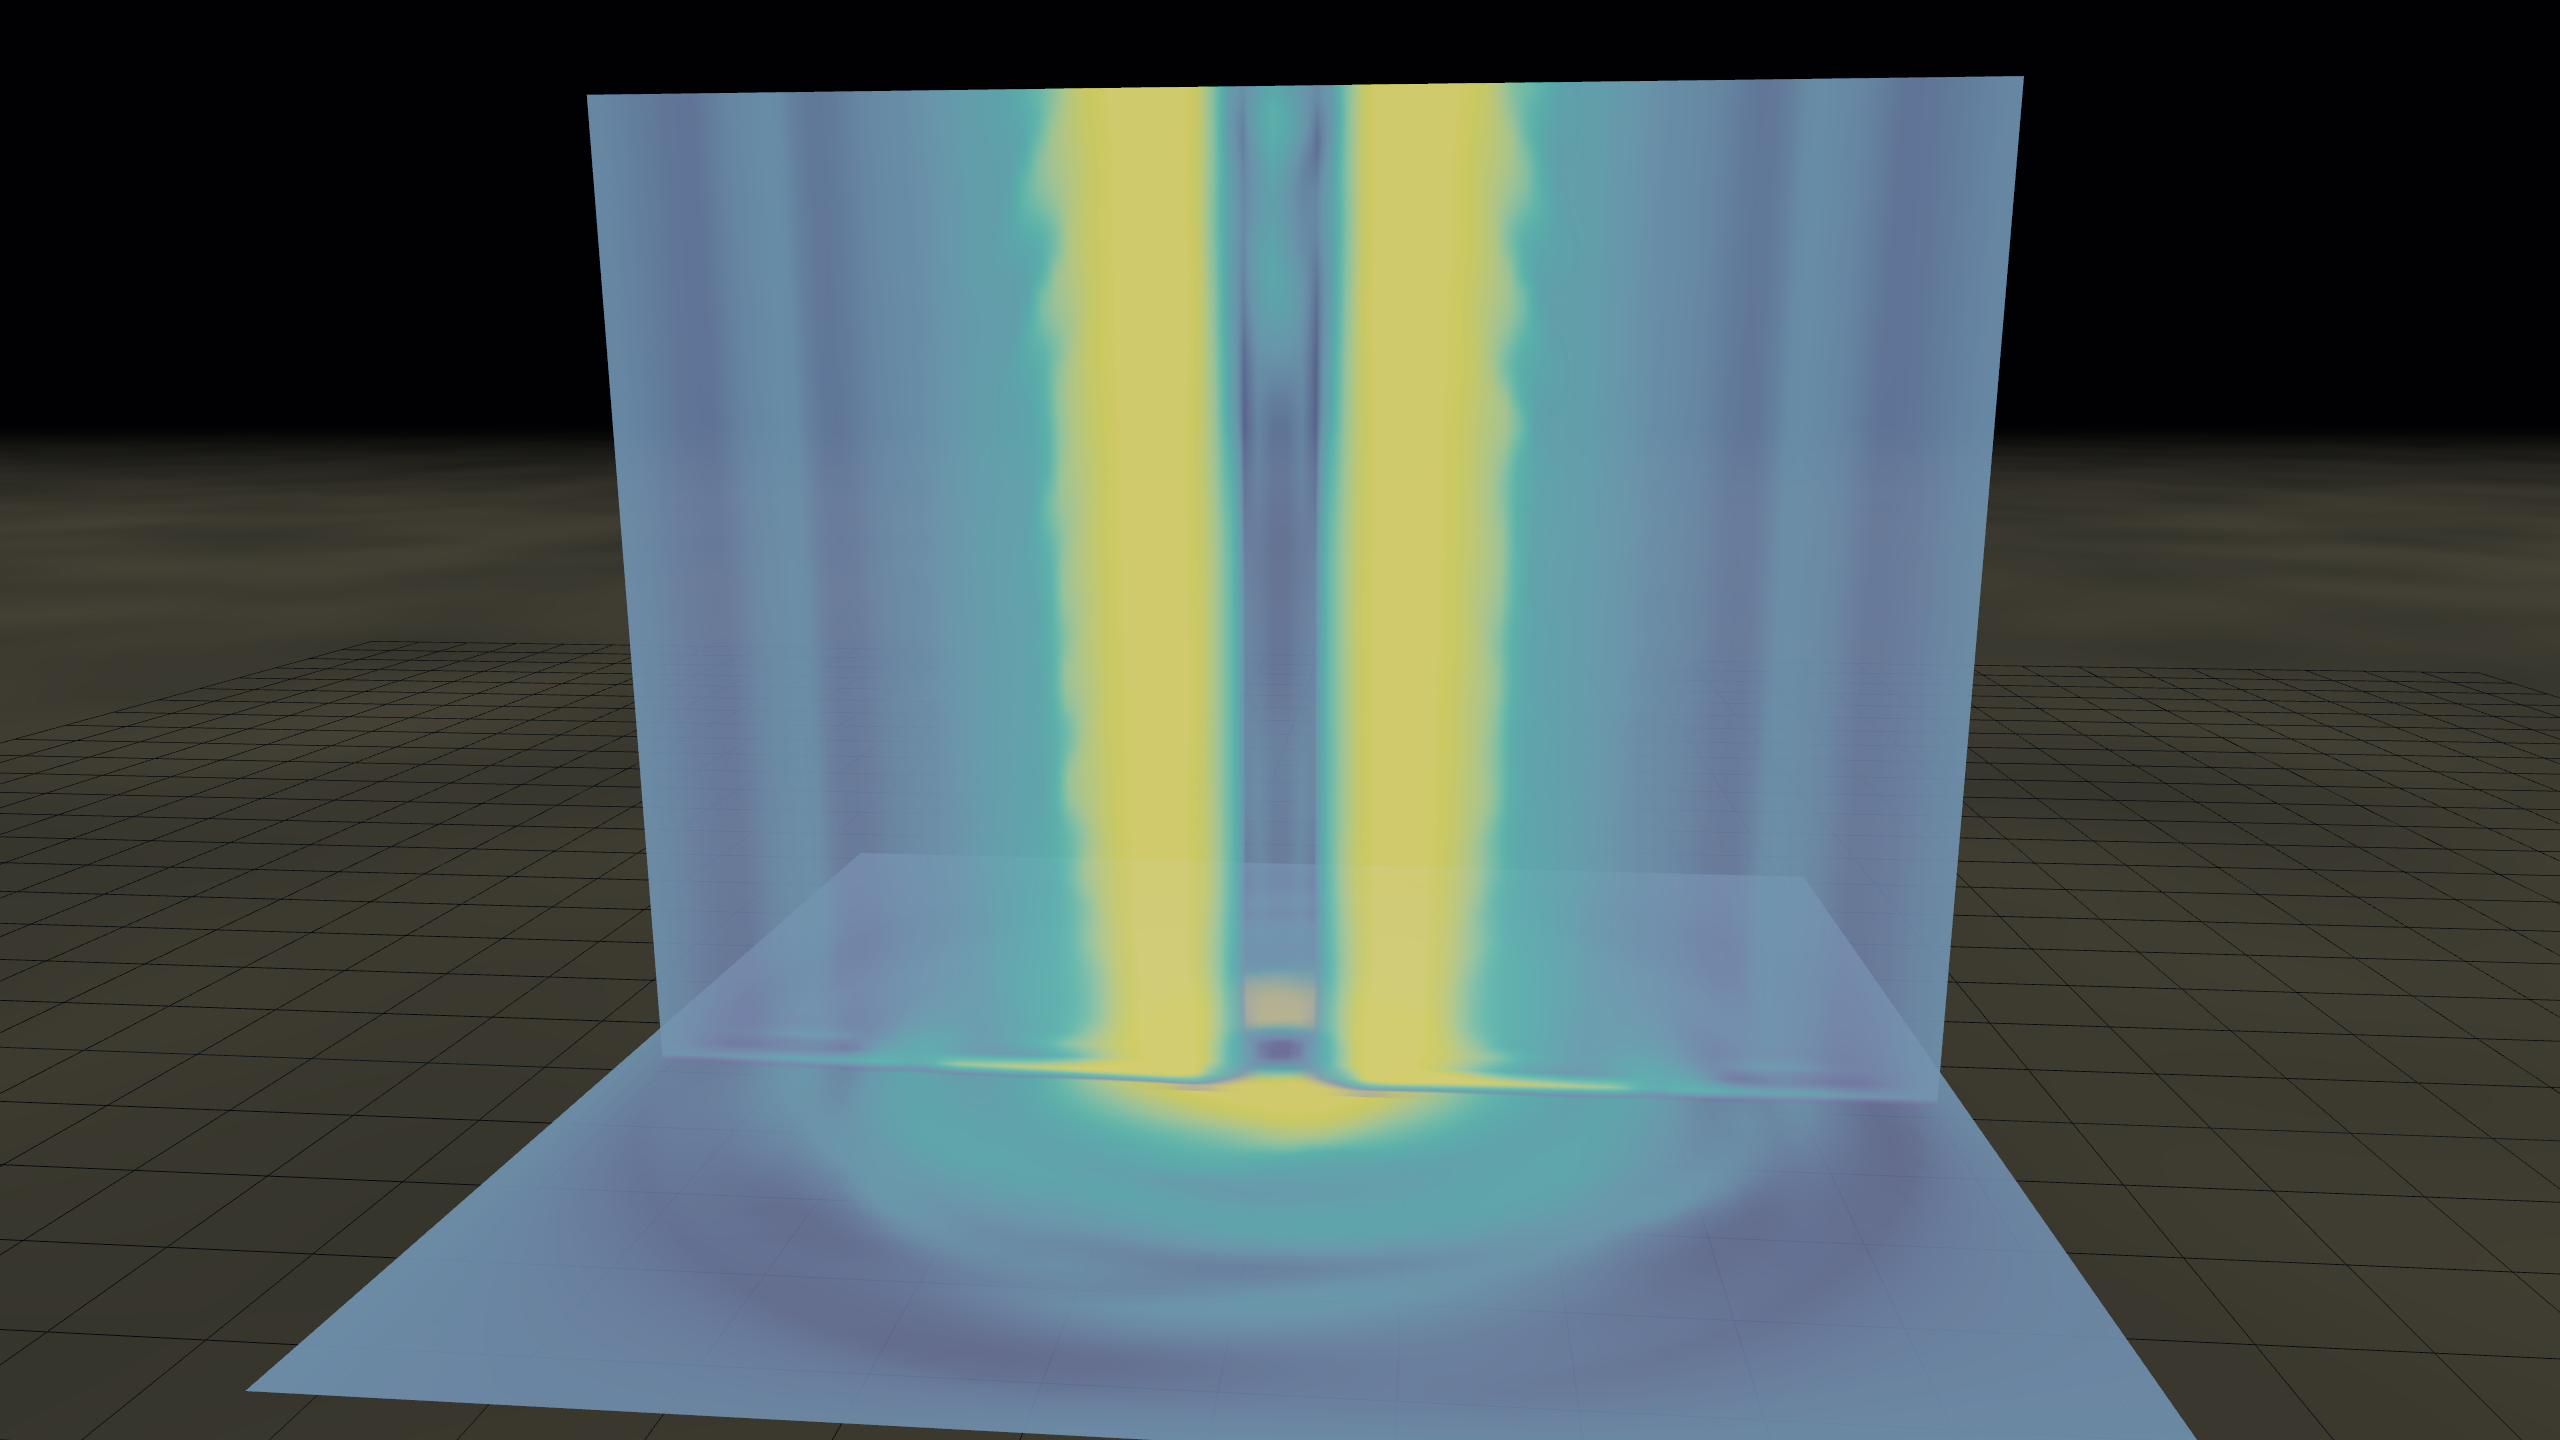
*|V| slice with LIC flow grain. Yellow = high speed (eyewall, around
80–95 m/s), dark = calm. Look closely and you'll see the **fine grain
streaming tangentially** along the eyewall — that's the LIC kernel
showing flow direction at every pixel. The horizontal slab on the
ground gives the classic bullseye: bright eyewall, dark eye, fading
glow in the inflow region.*
This is exactly what a Doppler-radar reflectivity-and-velocity overlay
of a real tornado looks like, just at much finer resolution.
---
## 6. Single-cell vs two-cell — the **swirl ratio**
A subtle but important fact: tornadoes don't all look the same inside.
There's a control parameter called the **swirl ratio** S — roughly,
the ratio of how much the boundary air is rotating to how much it's
flowing inward. Crossing a critical threshold (S ≈ 0.6, the
**Davies-Jones threshold**) flips the vortex into a different regime.
**Low swirl (S = 0.4) — single-cell vortex:**
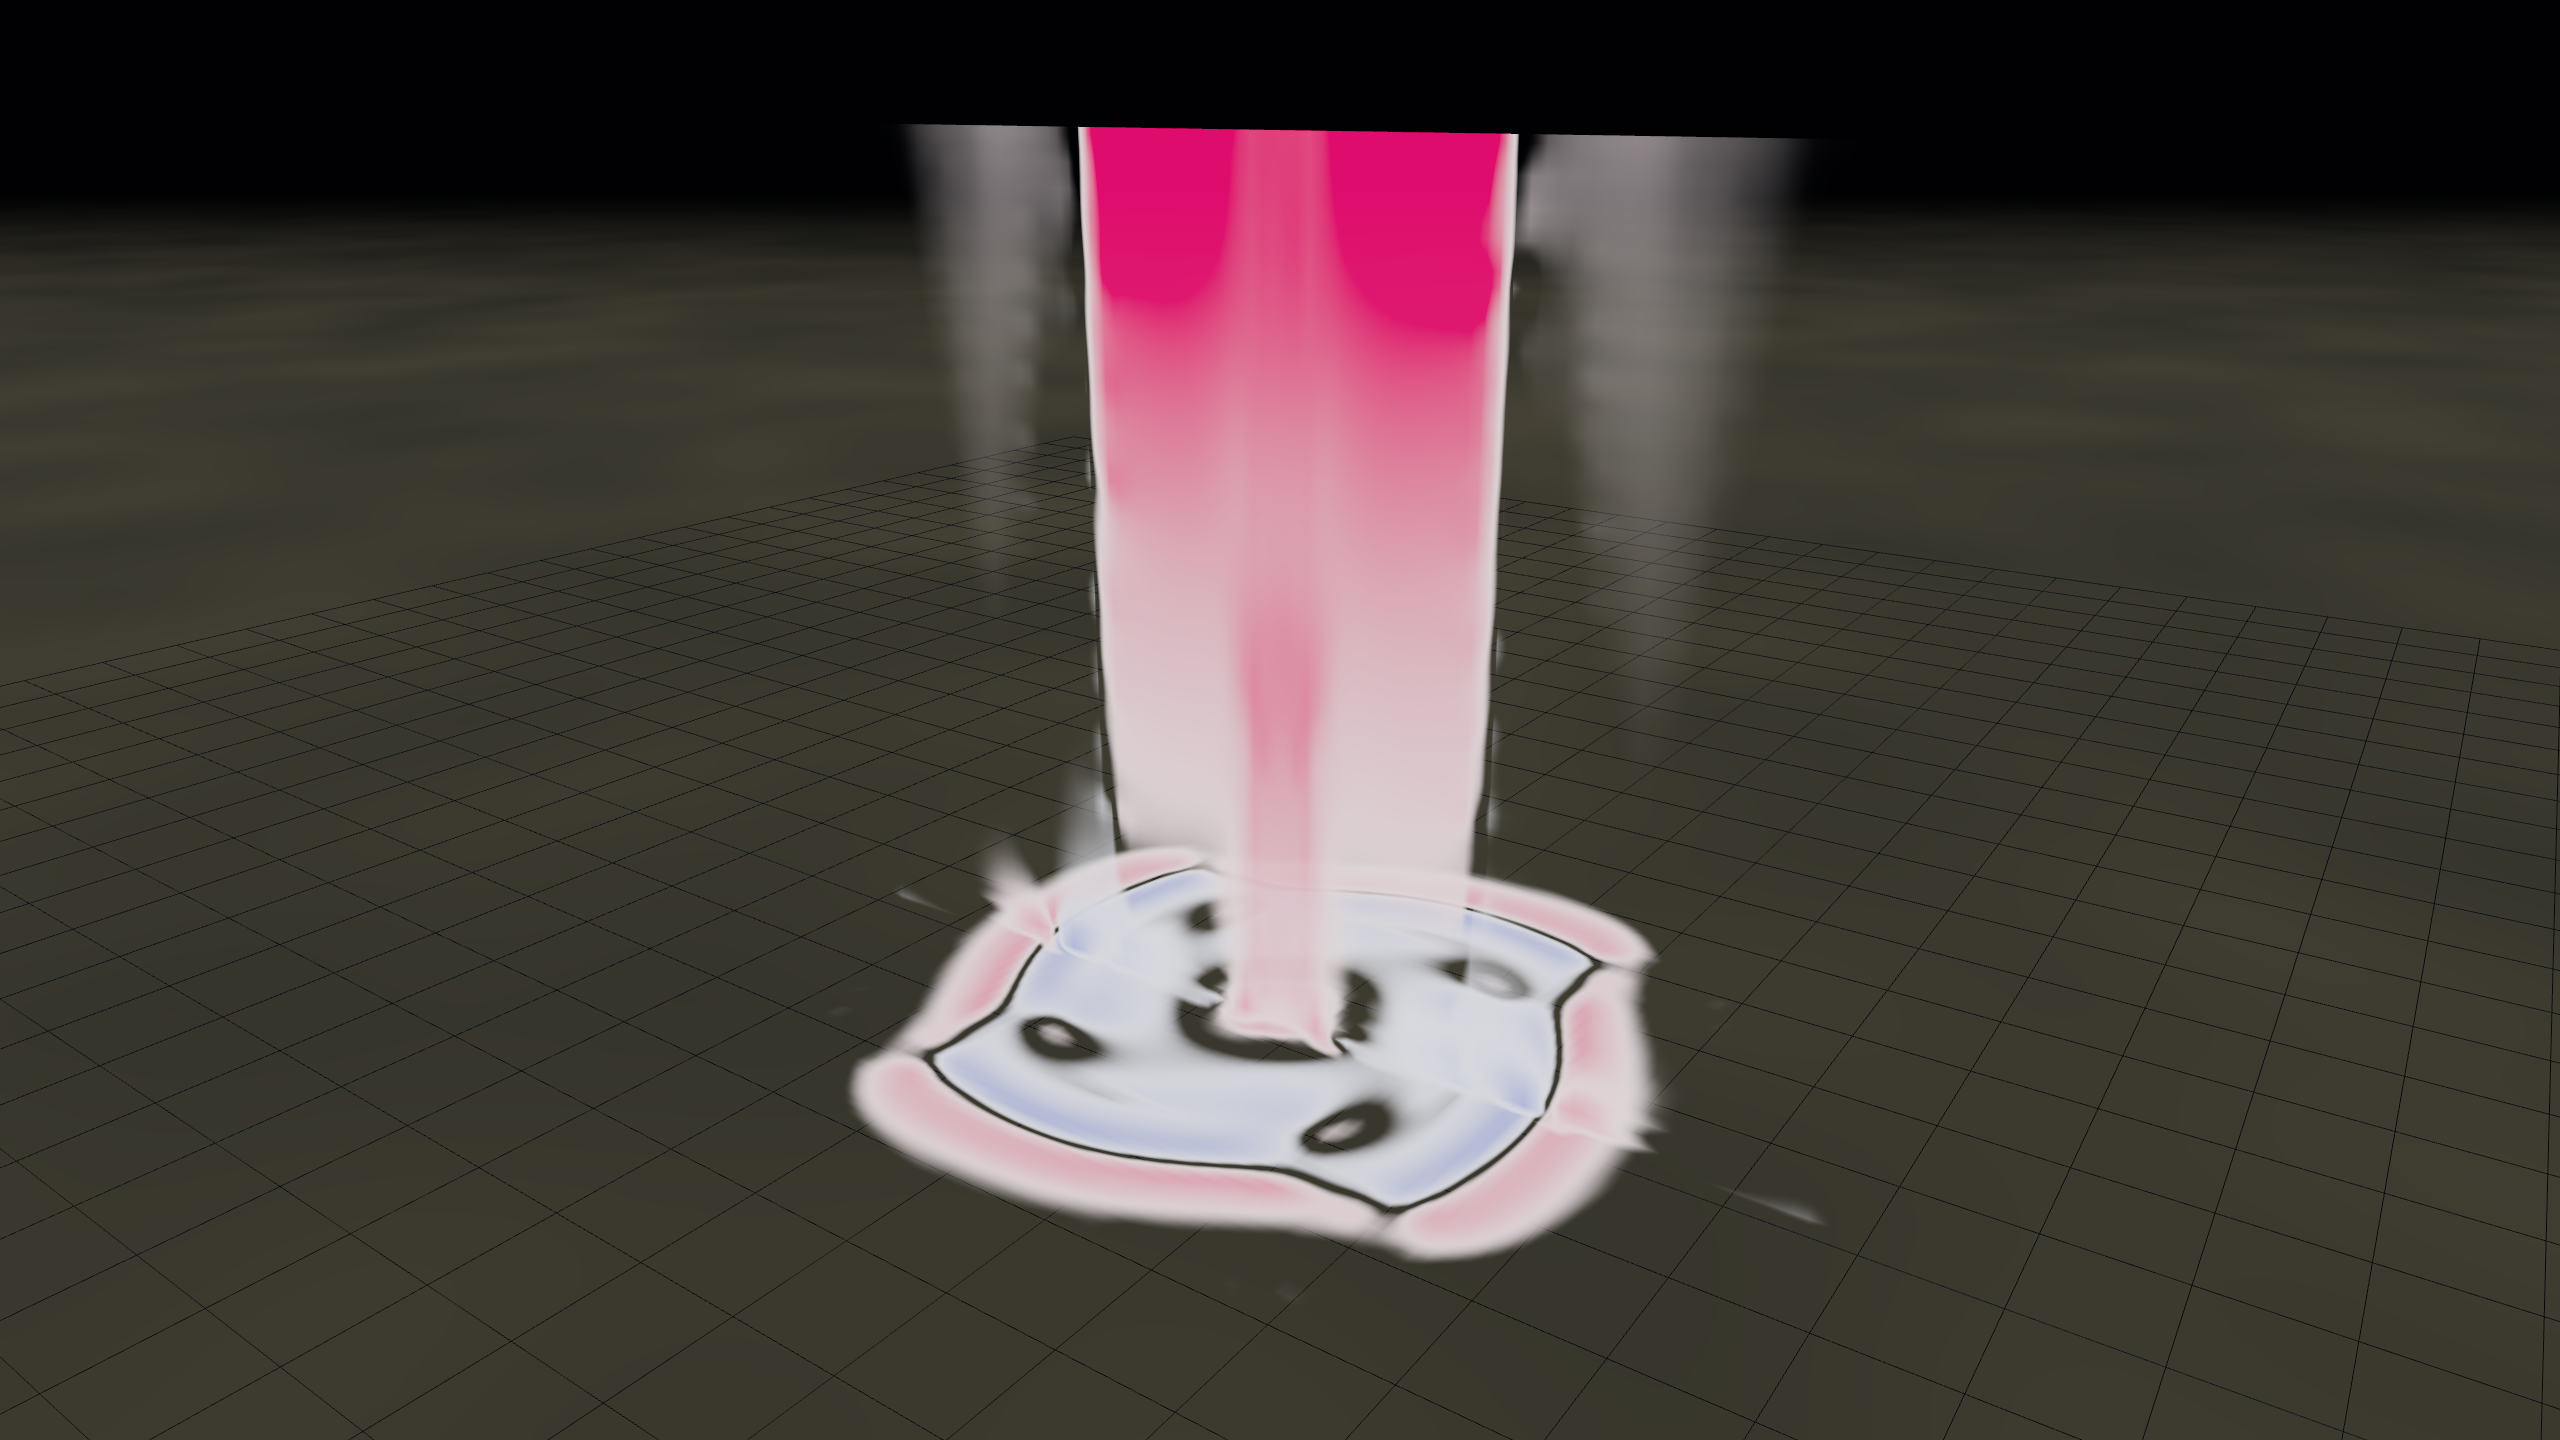
*V_z at swirl ratio 0.4. The vortex is single-cell: air goes up
everywhere along the axis. The tube is laminar, the column is a
clean continuous updraft.*
**Higher swirl (S = 0.85) — concentrated narrow column:**
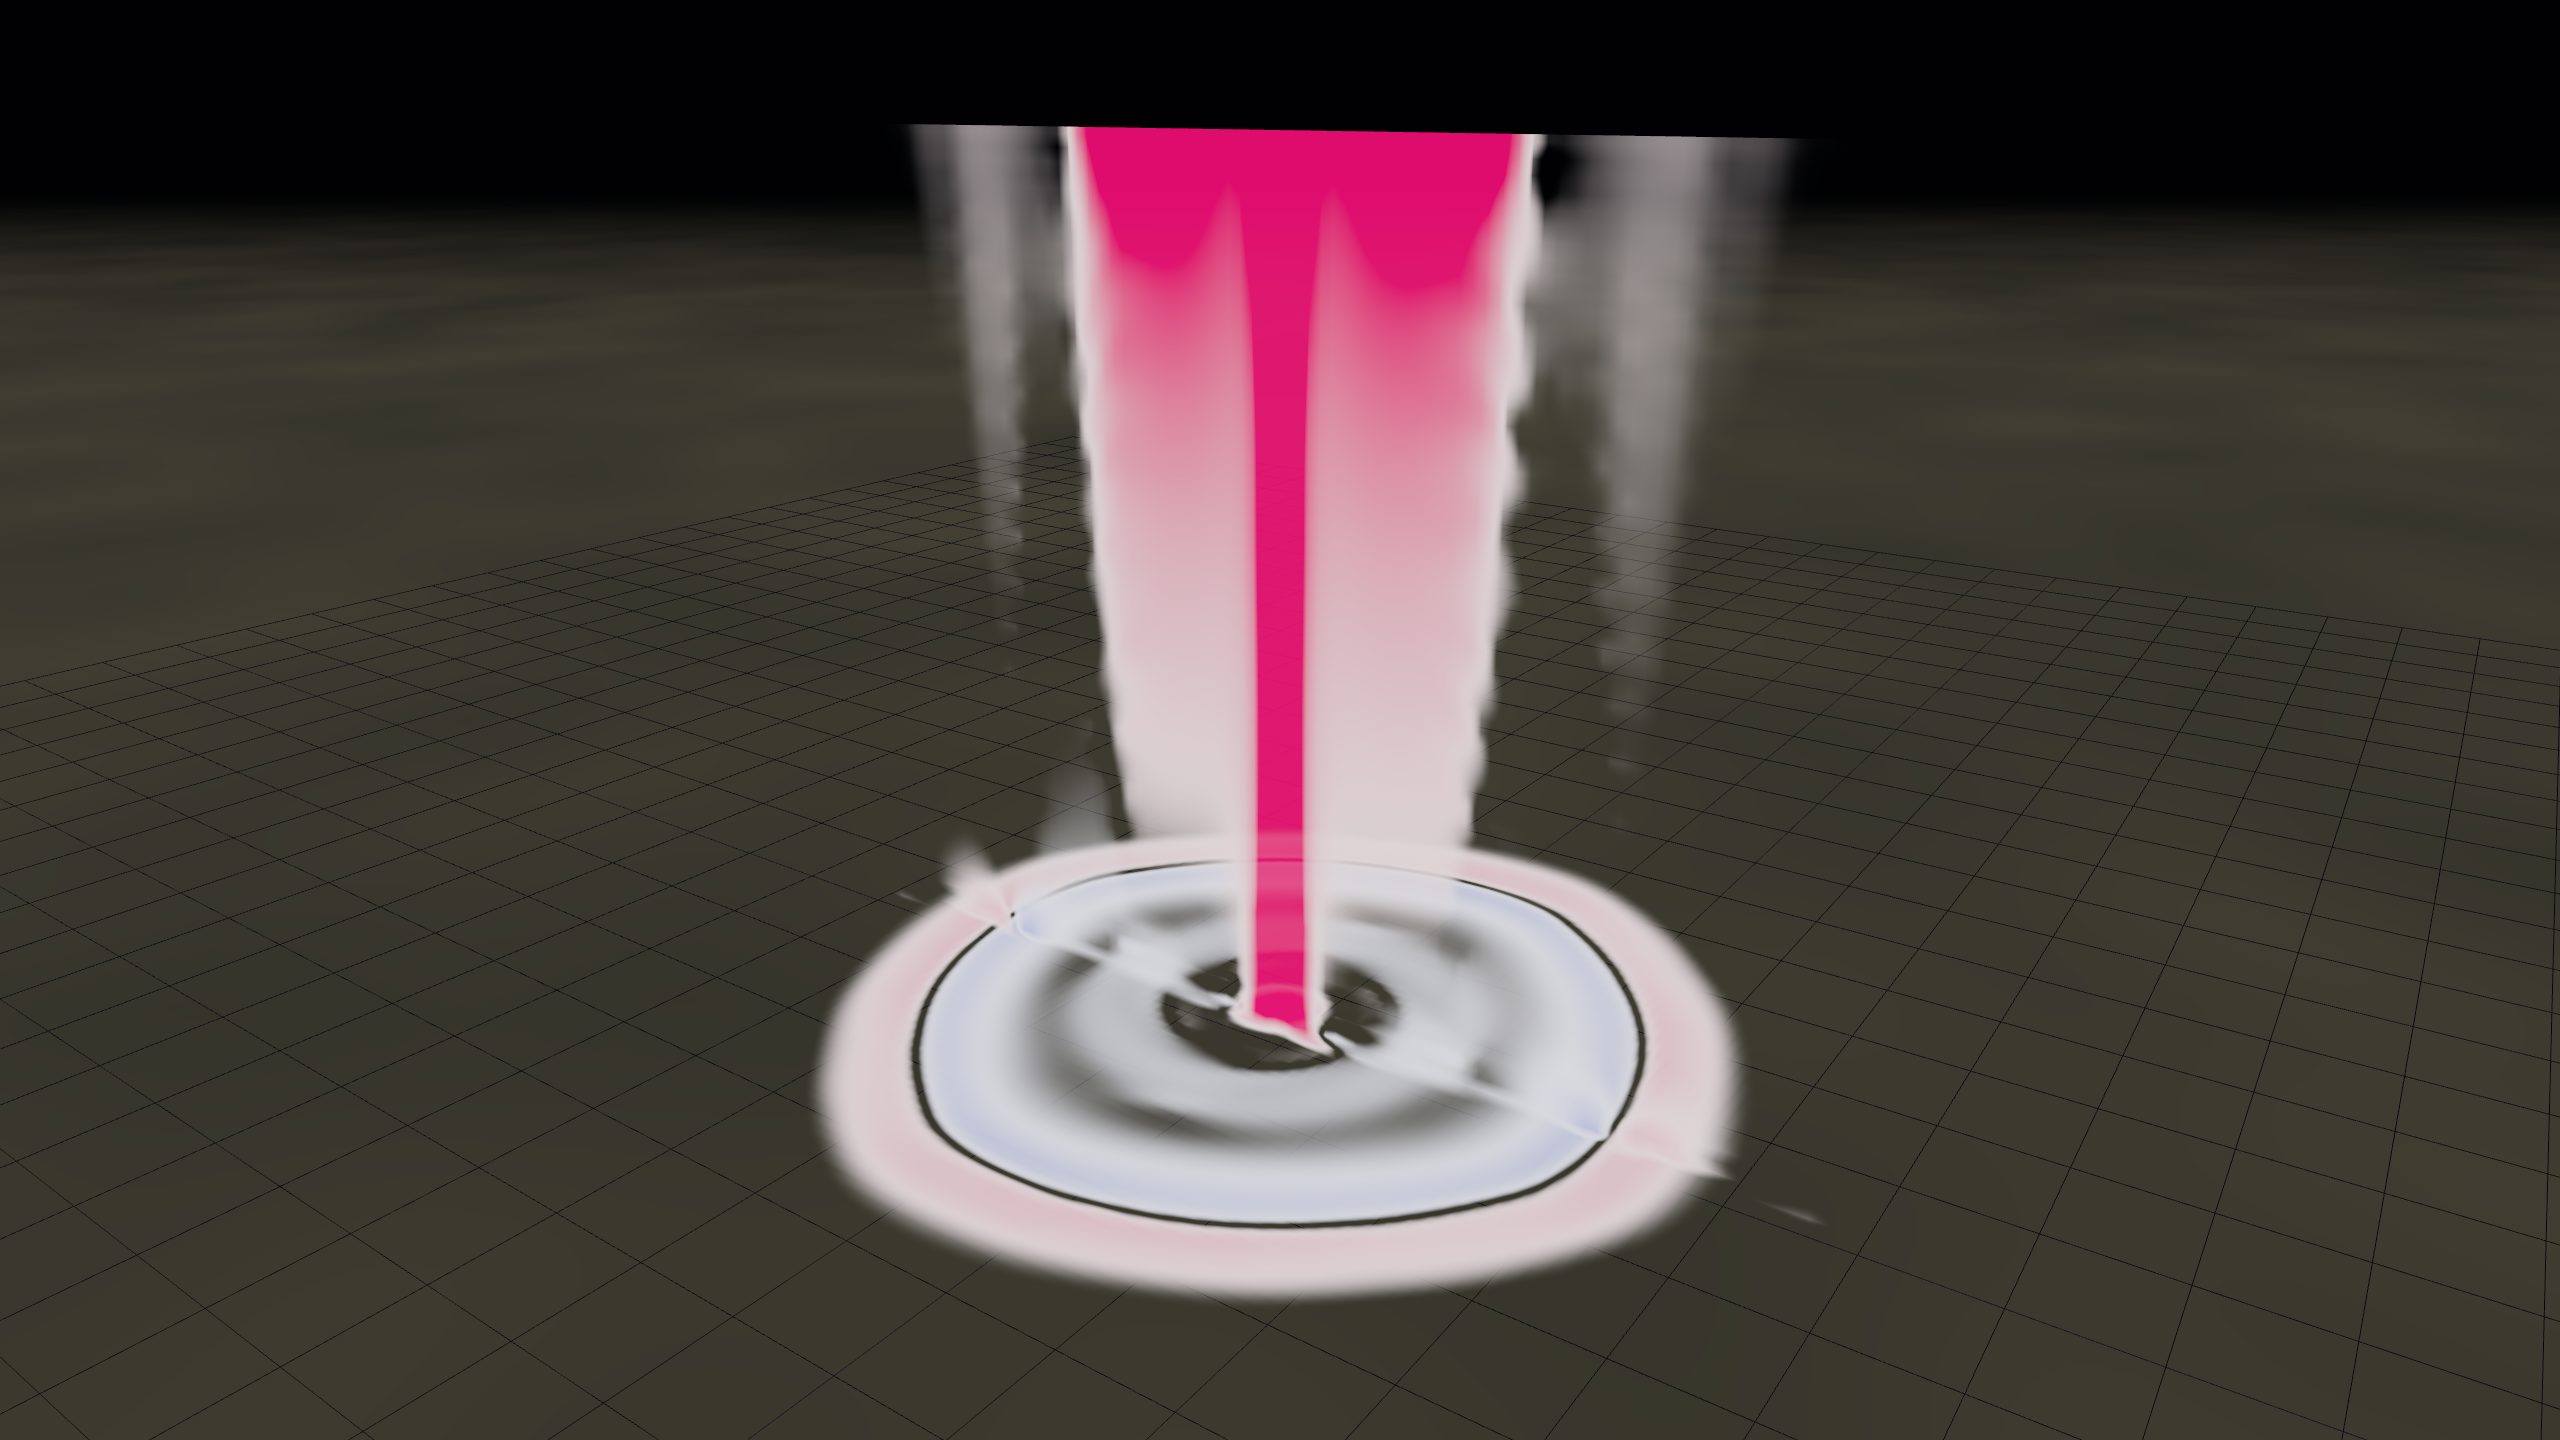
*Same view at S = 0.85. The updraft has tightened into a brilliantly
intense column. In real tornadoes (and at finer grid resolutions than
this 96³ run) the centre of the column would actually go **negative**
— a downdraft punching down the axis while the updraft moves to an
annular ring just outside. This is the iconic "two-cell" structure.*
---
## 7. Multi-vortex breakdown — what the most violent tornadoes do
Crank the swirl ratio high enough (S ≈ 1.2 here) and the central
downdraft of the two-cell vortex becomes unstable. The single tube
**breaks up into 2–6 sub-vortices** that orbit the main axis like
gears in a planetary system. The wind speeds *inside* the sub-vortices
add to the rotation of the parent vortex — locally producing the
fastest winds ever measured in the atmosphere (~140 m/s, ~315 mph).
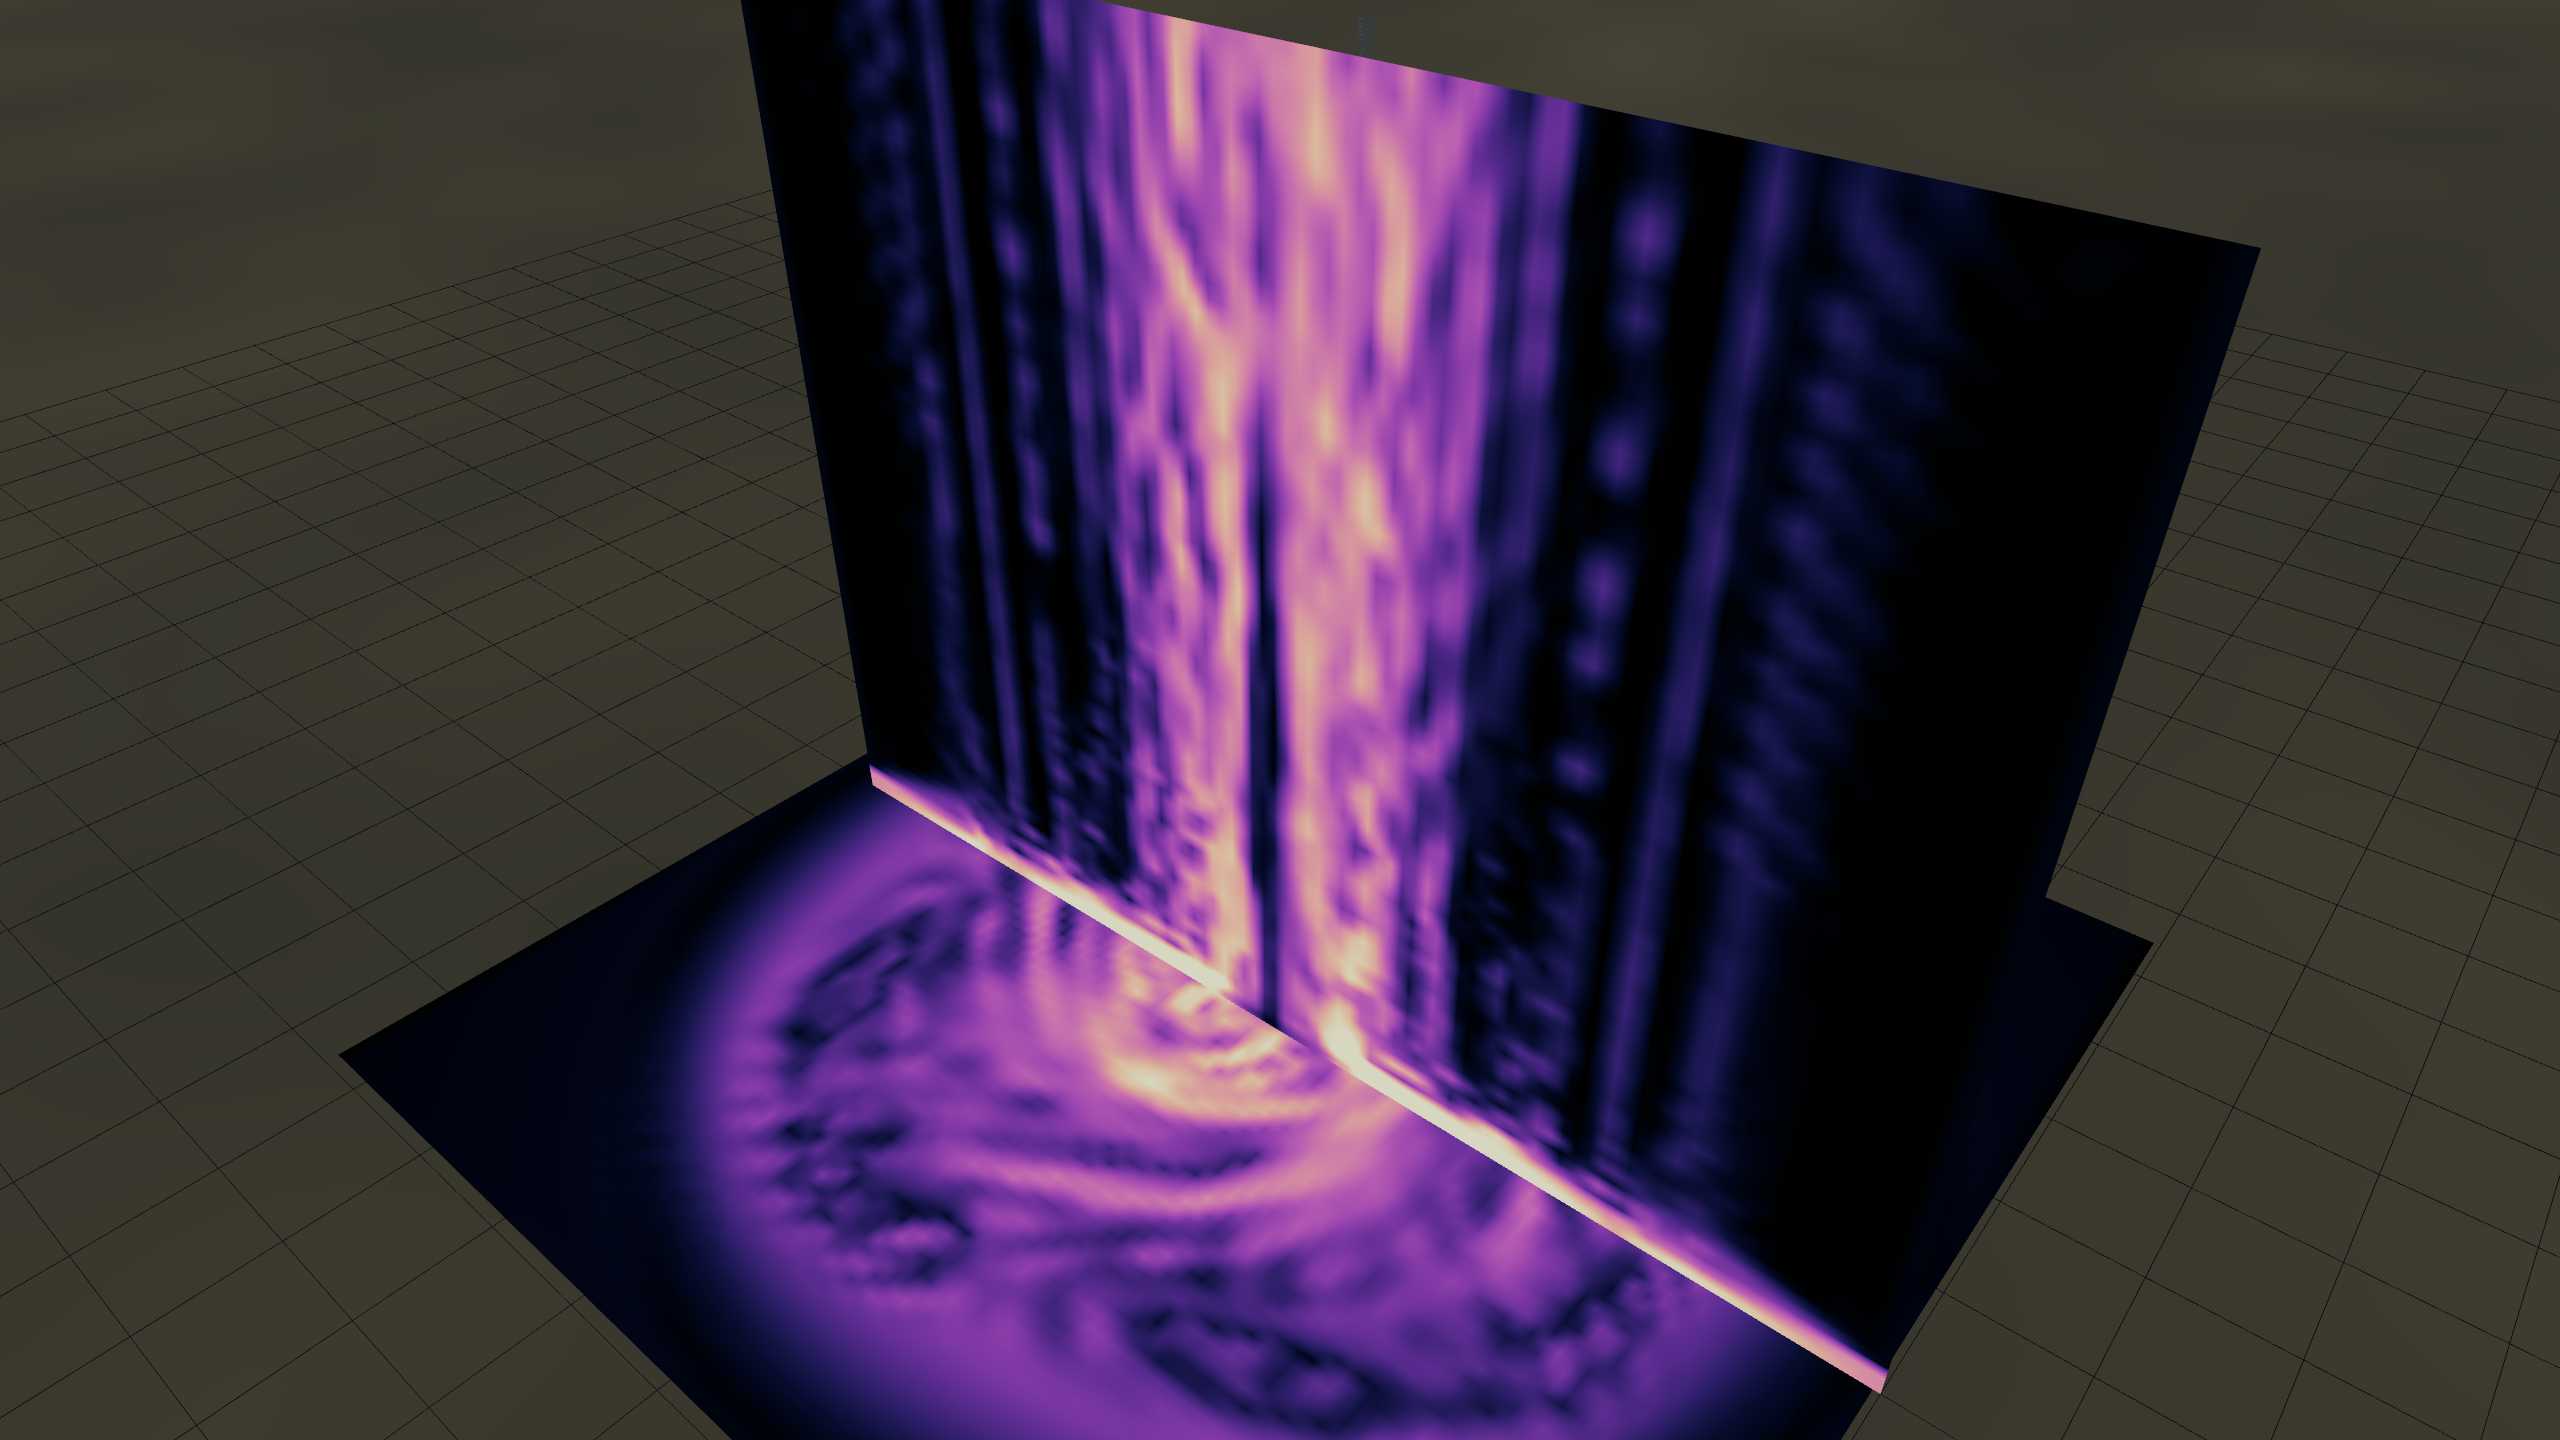
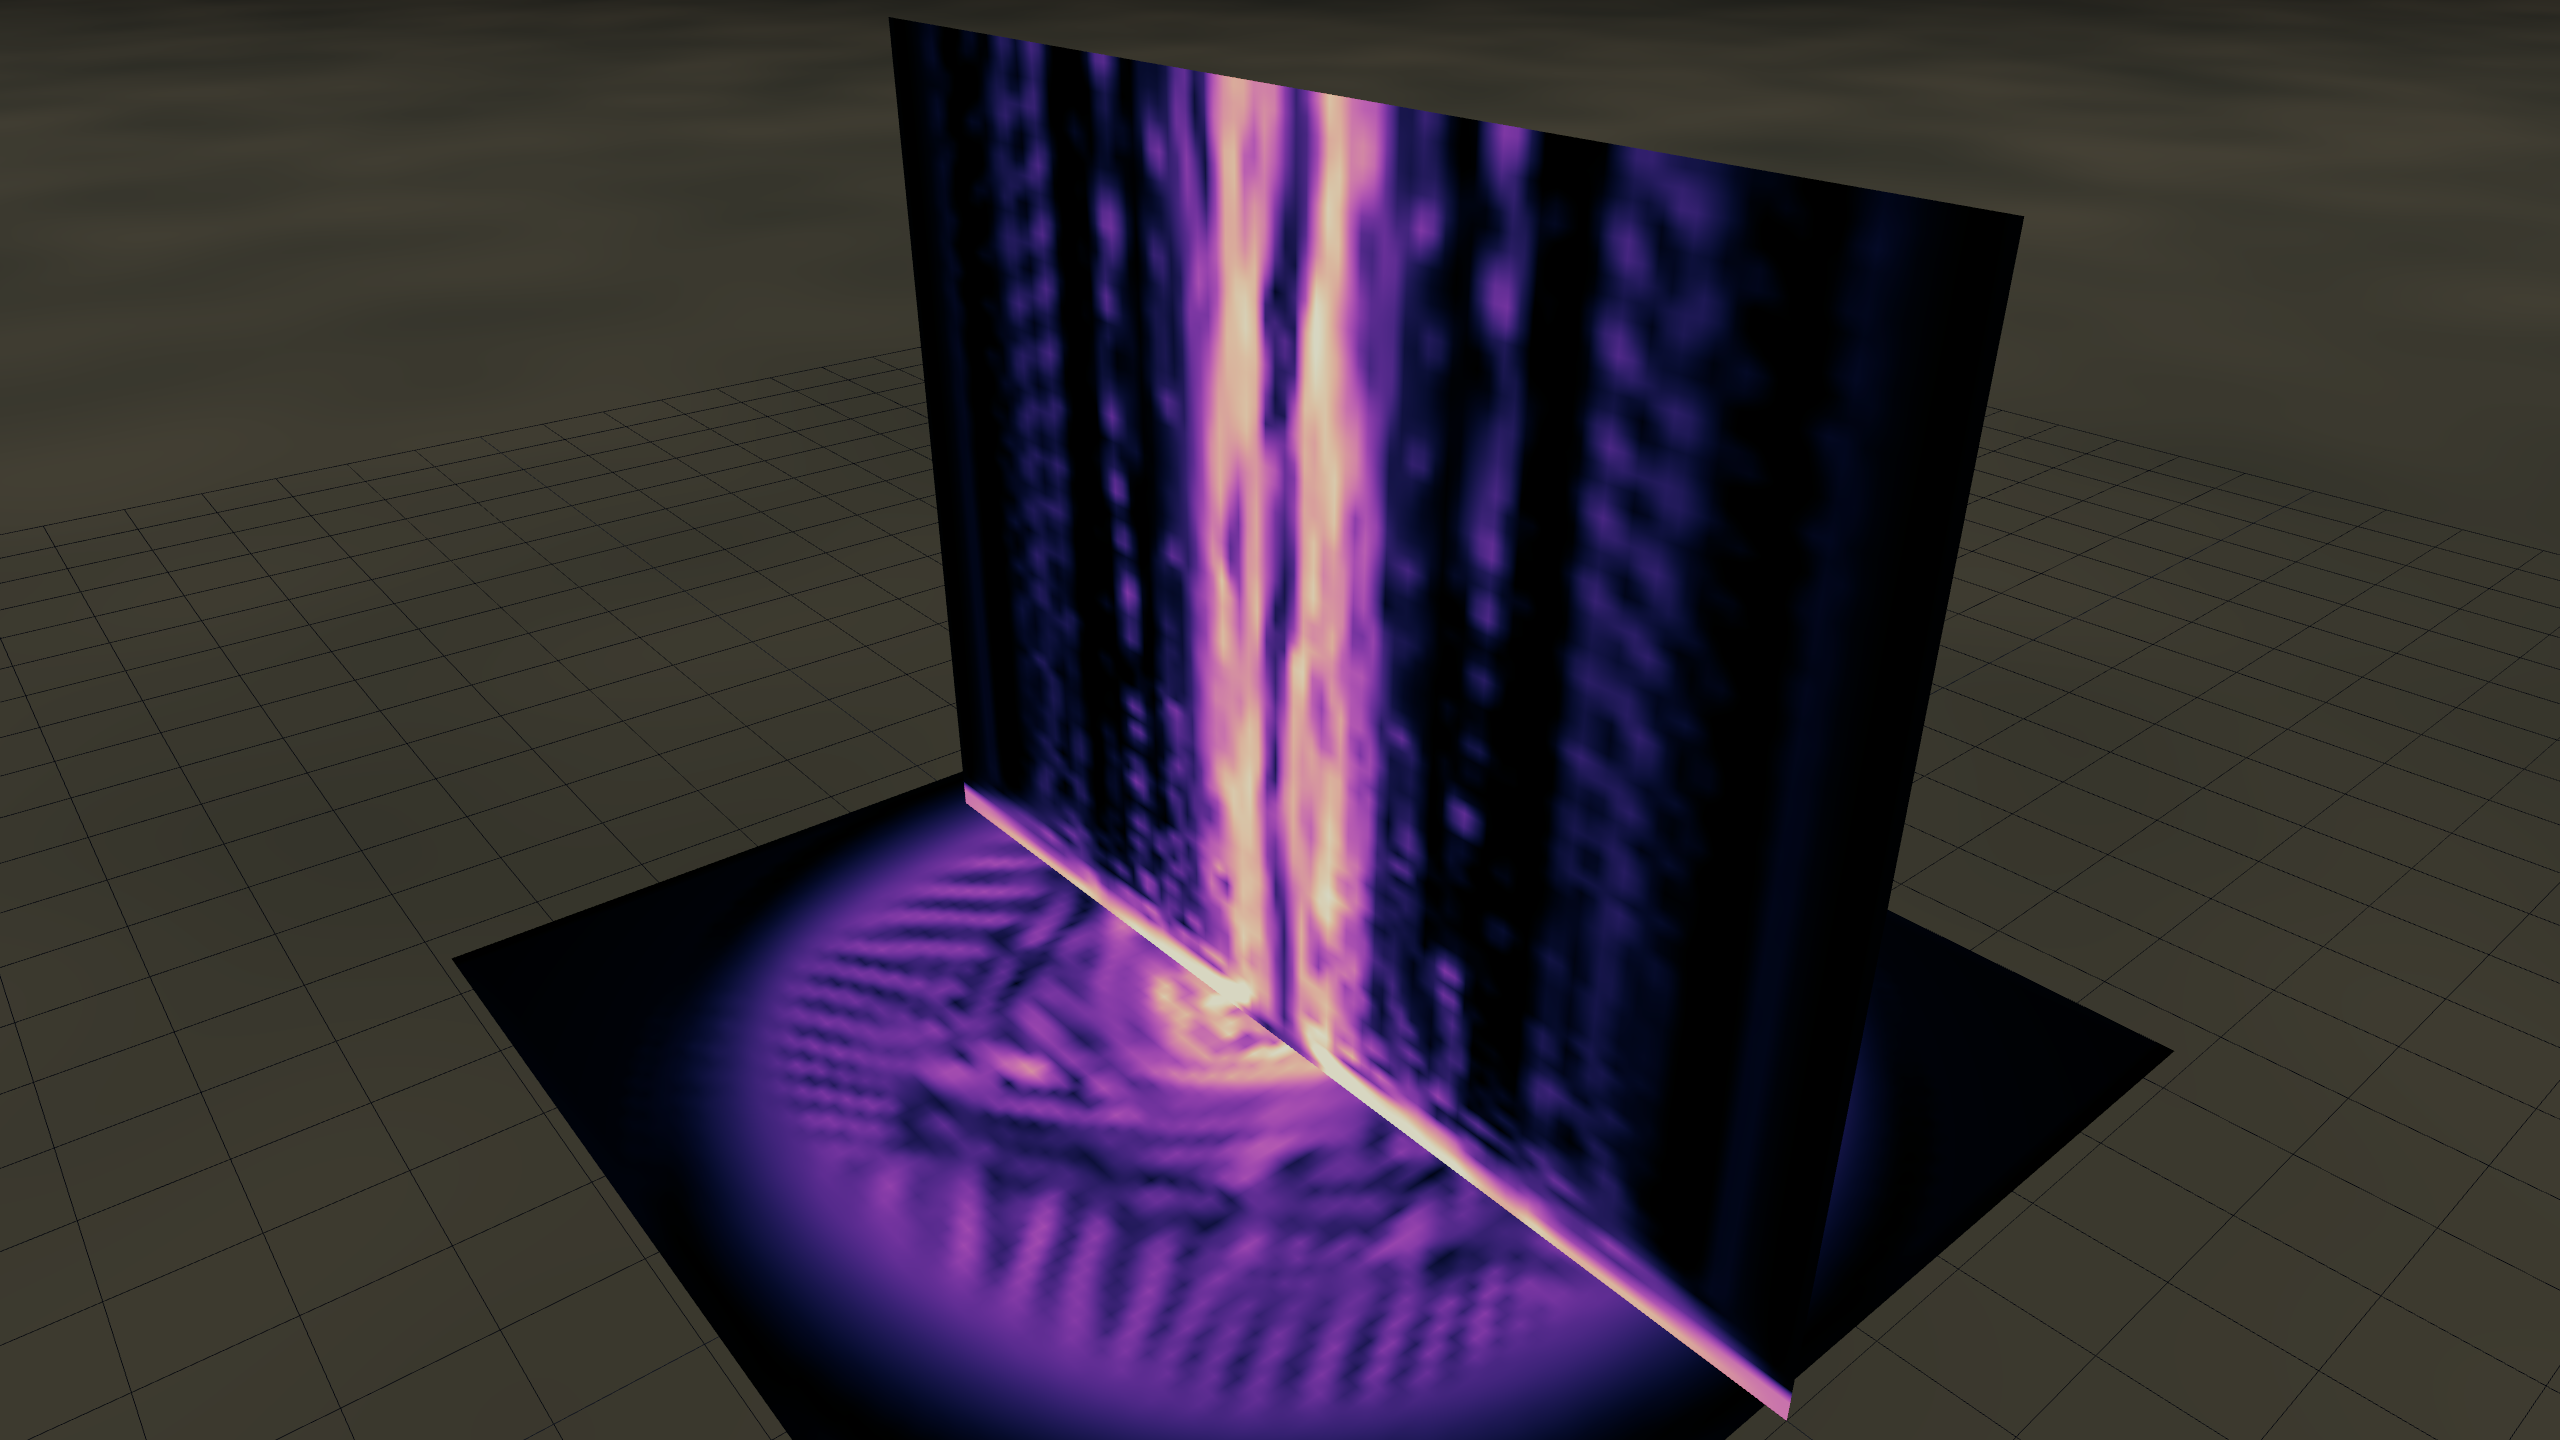
*Vorticity slices at S = 1.2 with V_max = 100 m/s. The horizontal slab
at the bottom shows the giveaway: instead of one bright ring, there are
**multiple bright spots arranged in a swirling pattern** — each one a
sub-vortex. The vertical slice shows the tube has gone from a smooth
column to a striated, almost combed texture as the sub-vortices roll
upward.*
The El Reno 2013, Hackleburg 2011 and Greensburg 2007 tornadoes were
all observed in multi-vortex configuration during their most violent
phases.
---
## 8. The recipe summary
To build a real tornado you need:
1. **Warm, moist surface air** — the fuel for buoyant updraft. The
simulator handles this via the **latent-heat** parameter: as moist
air rises into the cloud and condenses, it releases latent heat,
which drives more updraft, which sucks in more inflow, which
generates more rotation. Self-reinforcing.
2. **Cold, dry air aloft** — increases the temperature contrast,
destabilises the column, makes the convection violent.
3. **Wind shear in the lower atmosphere** — provides the
horizontal-axis vorticity that the updraft tilts into the vertical
to seed the rotation.
4. **A trigger** — the parent supercell thunderstorm and its
mesocyclone, which spins up the seed rotation over many minutes
before the tornado actually drops.
If any one of these is missing, you get rain, you get a thunderstorm,
you get a gustnado — but no tornado. All four together at a single
location is meteorologically unusual, which is why tornadoes are
relatively rare.
---
## 9. How to read the simulator's HUD
Once the sim is running and a vortex has formed, the bottom-left HUD
shows a "Validation — measured vs target" section that grades the
solution. Each row is a quantity the simulator measures *off the GPU*
and compares to the analytic target:
- **|V|_max** — should approach the configured `V_max` once the
inflow boundary has filled the interior.
- **ΔP core** — should approach the cyclostrophic target −ρ·V_max².
- **|ω|_max** — should approach 2·V_max/R_max, the Burgers–Rott peak.
Green chips mean within 15% of target; amber within 40%; red beyond.
If everything's green, the tornado you're looking at is a properly
balanced cyclostrophic vortex. If something's red, either the
boundary forcing isn't strong enough (raise `V_in` or `S`) or
numerical dissipation is winning (raise `vortConfine` or
`latentHeat`).
---
*All figures generated by `bun capture --recipe …` (or custom param
sets) from this simulator's WebGPU canvas. To regenerate, ensure
`bun dev` is running and use `bun capture --all` to refresh every
illustration in `docs/illustrations/`.*